Bridge Intelligence
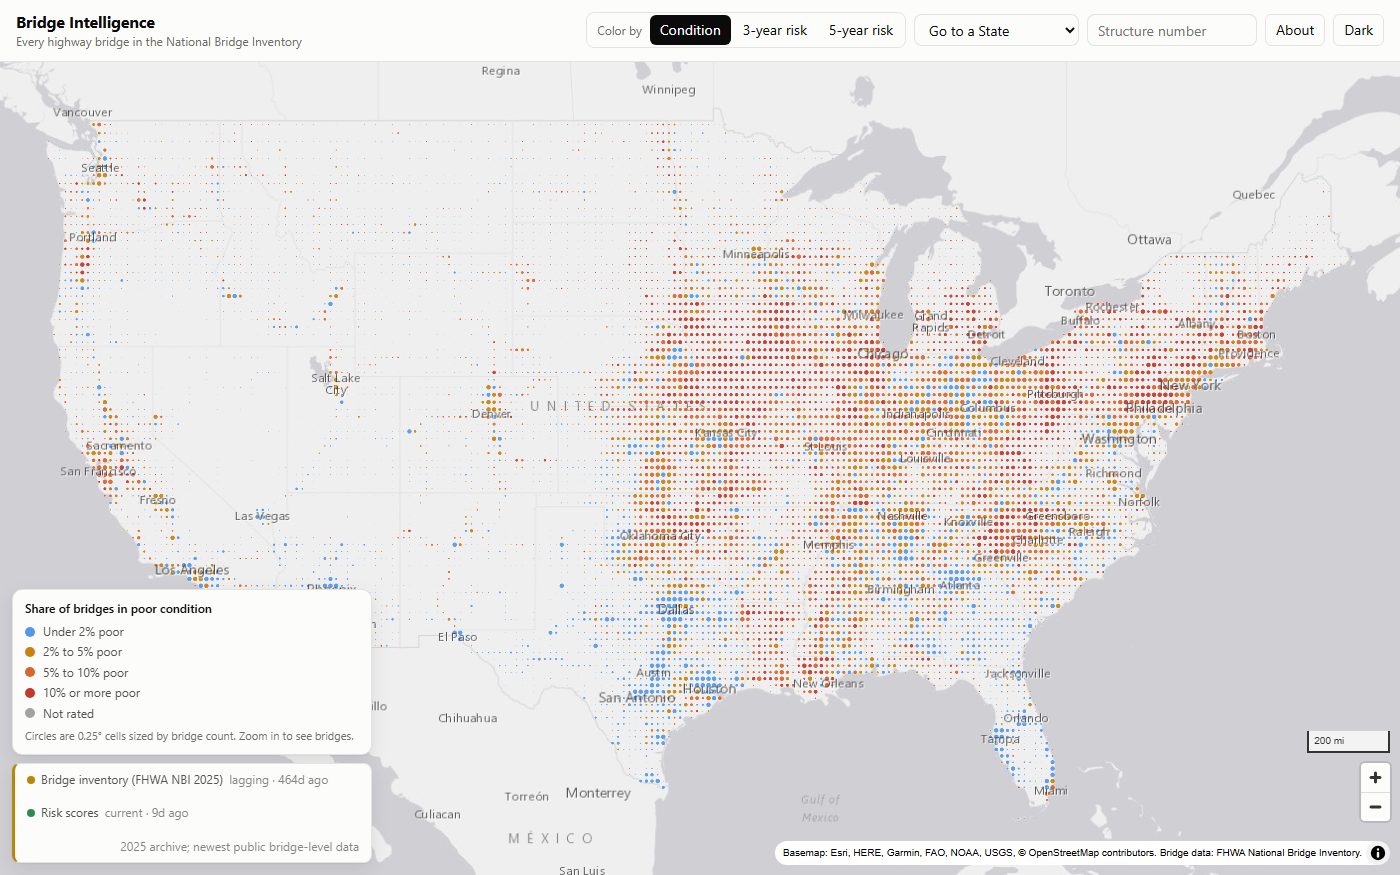
6.7% of America’s 624,190 highway bridges are rated Poor, and a machine-learning model estimates each one’s odds of getting worse within three years.
Question
Bridge condition usually surfaces as a single headline after something has already gone wrong. I wanted to see every bridge at once, and to ask which ones are actually likely to get worse next, not just which ones are already rated poorly.
Function
Maps the condition of all 624,190 active bridges in the FHWA National Bridge Inventory, then layers on a model trained on 34 years of inspection history that estimates each bridge’s odds of its lowest rating dropping within 3 or 5 years. Selecting a bridge opens its full rating history back to 1992 and a ranked breakdown of what is actually driving its score, current condition, age, traffic, and State, rather than just listing the inputs.
Limitation
Risk scores are statistical estimates from inspection records, not engineering assessments of any specific bridge, and the model over-predicts recent years because real decline has become less common than the training period assumed. State is one of the largest inputs, which partly reflects how differently each State inspects and rates its bridges rather than the bridges themselves. About 1,200 bridges are missing a coordinate and are counted in the totals but left off the map.