CAISO Market Pulse
An interactive snapshot of CAISO real-time market prices across every reporting node.
Question
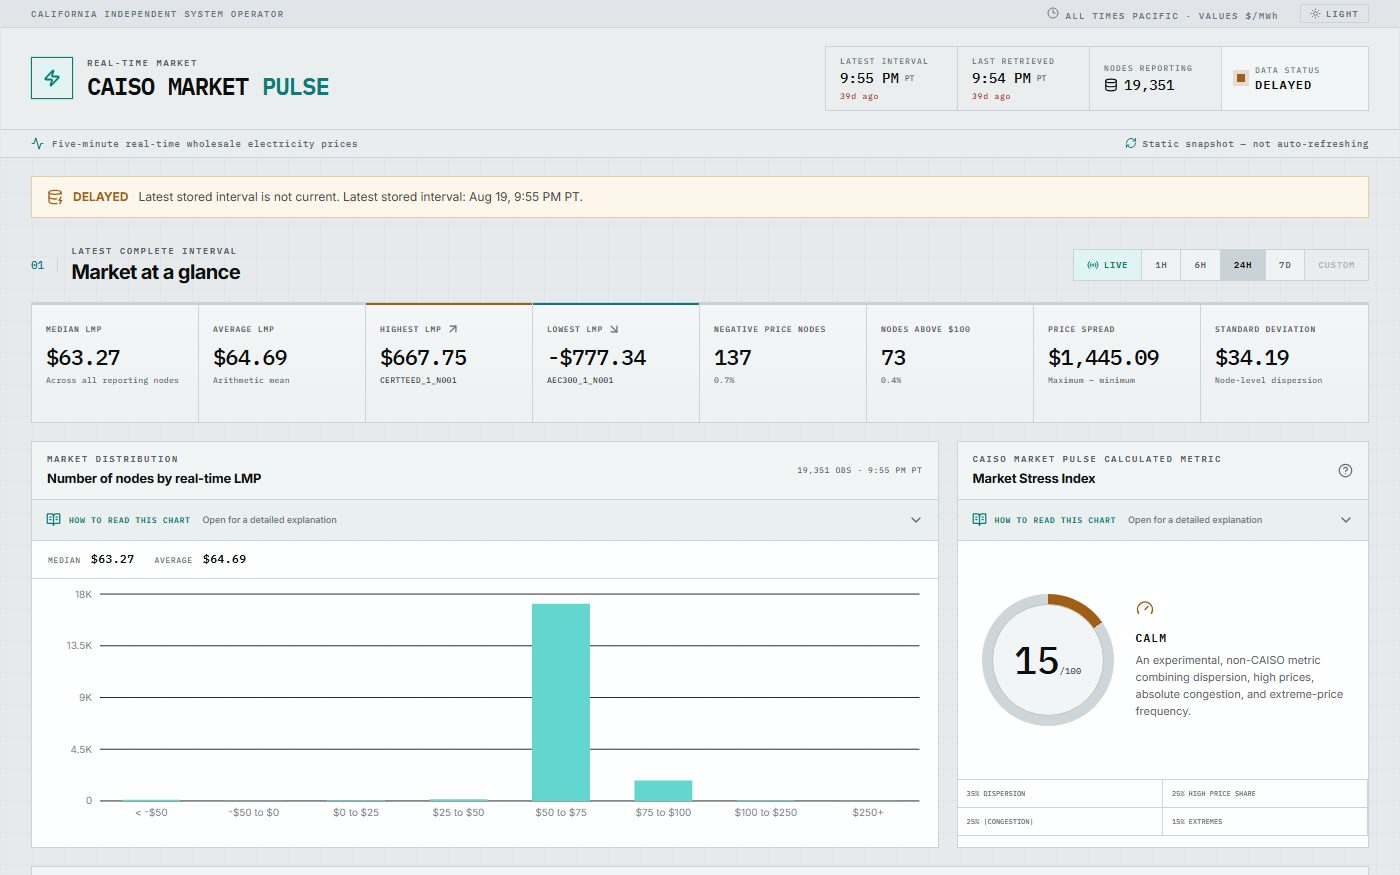
California’s real-time market swings widely through the day, and most views of it aggregate to a handful of hubs. Congestion and negative pricing happen at the node level, so I wanted to look at the full set rather than a sample.
Function
Analyzes CAISO real-time market observations across 19,351 pricing nodes at five-minute resolution, splitting each price into its energy, congestion and loss components. You can see the distribution across every reporting node, rank congestion in both directions, find where prices went negative, and open the history of any individual node.
Limitation
CAISO publishes prices for thousands of nodes, but the hosted version here uses a saved dataset rather than continuously pulling new observations, so it is a snapshot rather than a live feed. It measures wholesale prices in dollars per megawatt-hour, which are not retail rates, and it does not show generation. Missing values are left missing rather than filled with zero, since a missing price is not a price of zero.