U.S. Data Center Density
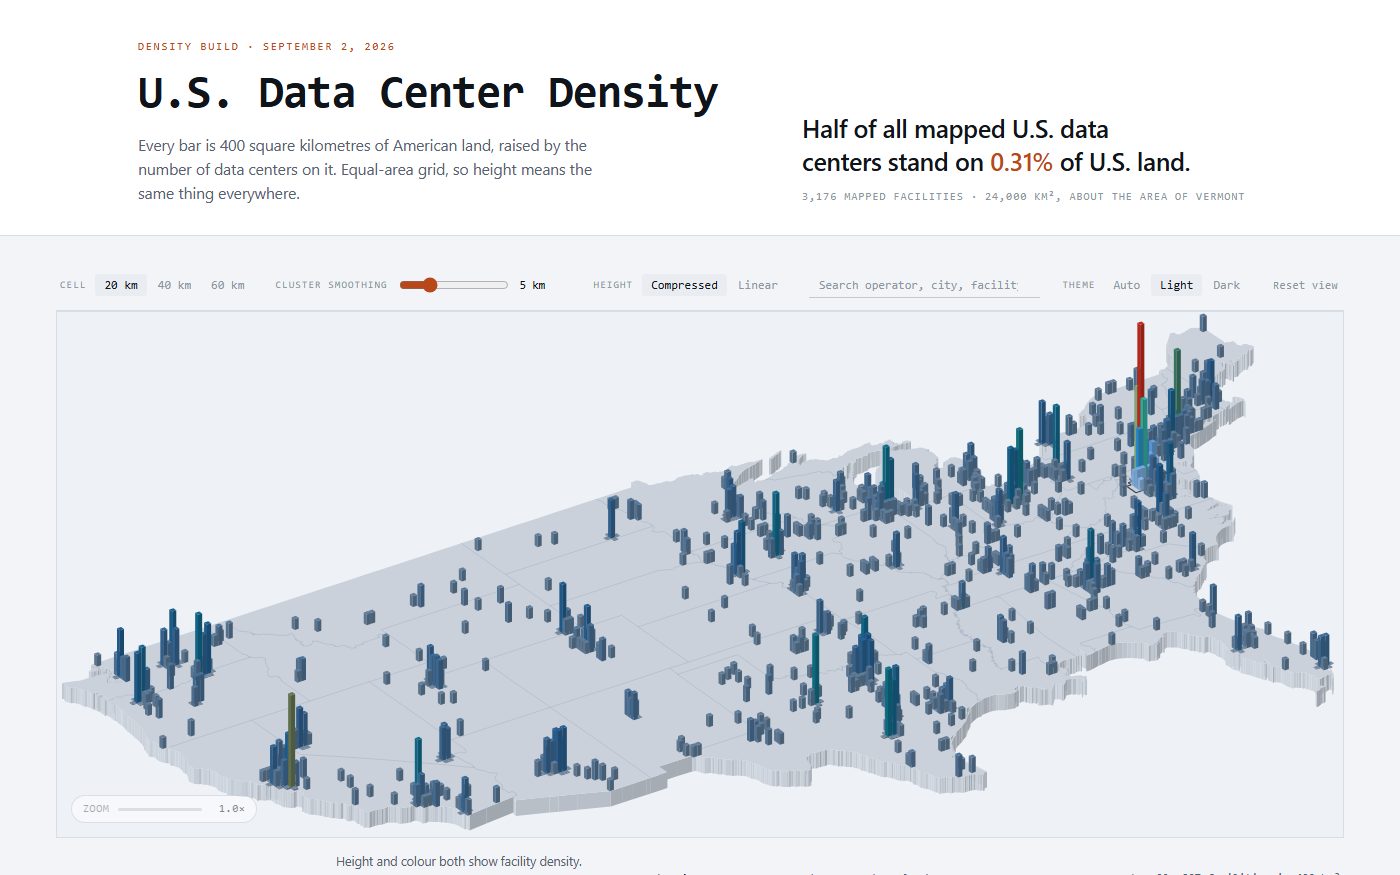
Half of mapped U.S. data centers fall within grid cells covering about 0.31% of U.S. land area.
Question
Plotted as dots, a few thousand data centers just look like scatter. I wanted to see how concentrated they actually are, which needs a map where height and area mean the same thing everywhere.
Function
Bins mapped facilities into 20-kilometre equal-area cells across the lower 48 and draws them as a relief, so cell height is comparable anywhere on the map rather than distorted by the projection. Half of the mapped facilities fall inside roughly 60 cells, about 0.31% of U.S. land area. Clustering groups nearby cells into recognizable markets you can select and zoom to.
Limitation
An empty cell means no public record, not the absence of a data center. Some coordinates are geocoded to city centroids rather than to buildings, so a dense cell can overstate how tightly clustered the sites really are. Capacity is deliberately left out, since announced megawatts and operating megawatts are not comparable quantities.