Data Center = A City
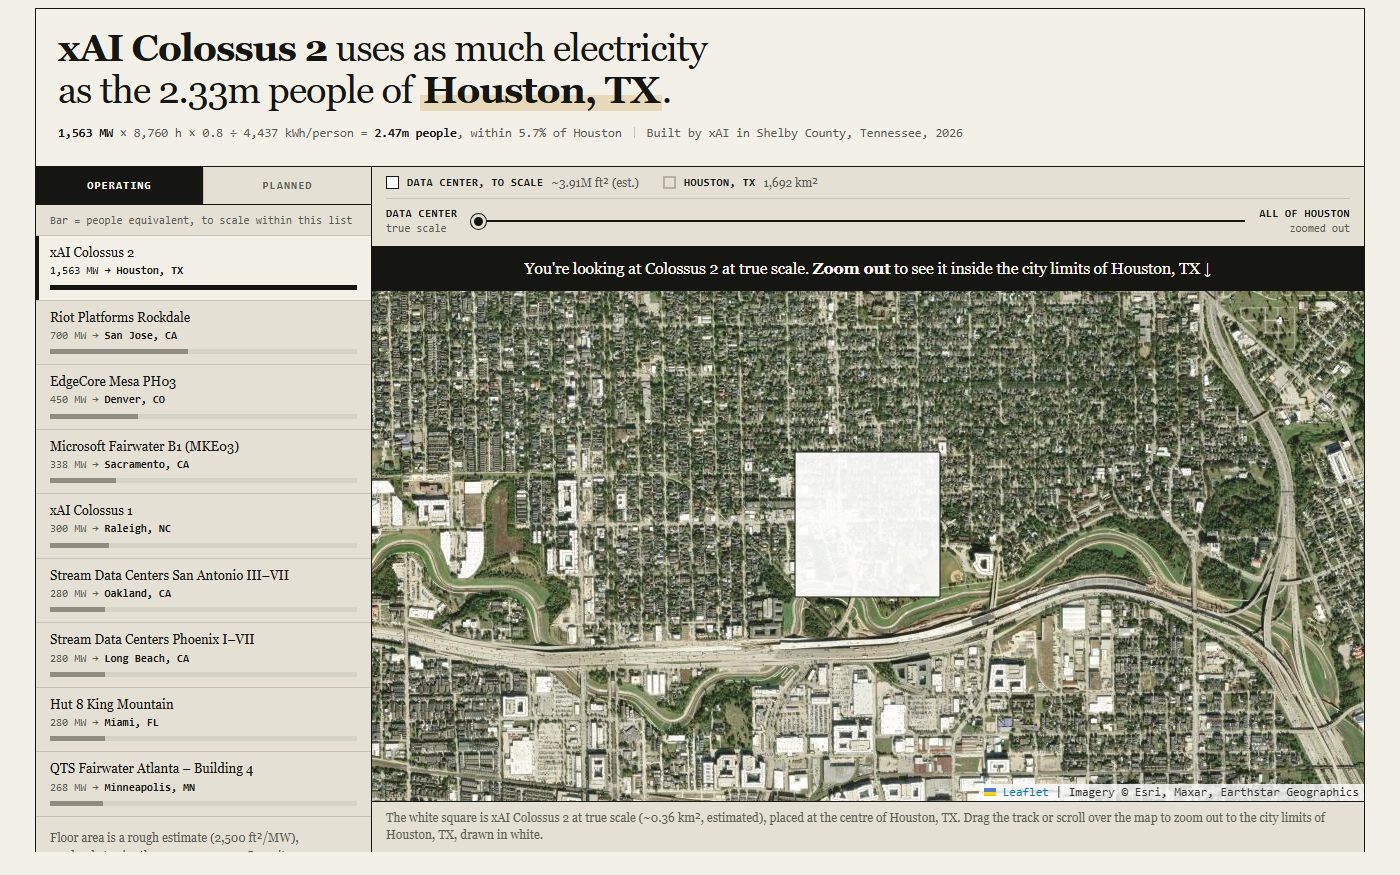
xAI’s Colossus 2 draws as much electricity as every home in Houston; the largest announced U.S. campus matches Illinois and Iowa combined.
Question
Data-center capacity is quoted in megawatts, which doesn’t mean much on its own. I wanted a unit anyone can feel: how many people’s homes does one building run?
Function
Takes each data center’s yearly electricity, which is capacity times 8,760 hours times an 80% utilization assumption, and divides it by what the average American uses at home in a year, about 4,437 kWh. The result is a population, matched to the U.S. city, state, or pair of adjacent states closest to it. The footprint is drawn at true scale on satellite imagery of that place: you start on the building and zoom out until it is a speck inside the city limits or state borders it is matched to.
Limitation
Per-capita residential electricity is an average. An all-electric house in Phoenix uses several times a Manhattan apartment. Capacities are as reported in public announcements and filings, and the announced gigawatt campuses are shown at full build-out, which is years away and may never be reached. Floor areas are rough estimates used only to size the on-map square; the comparison is about electricity, not land.