A Reactor Full of Lights
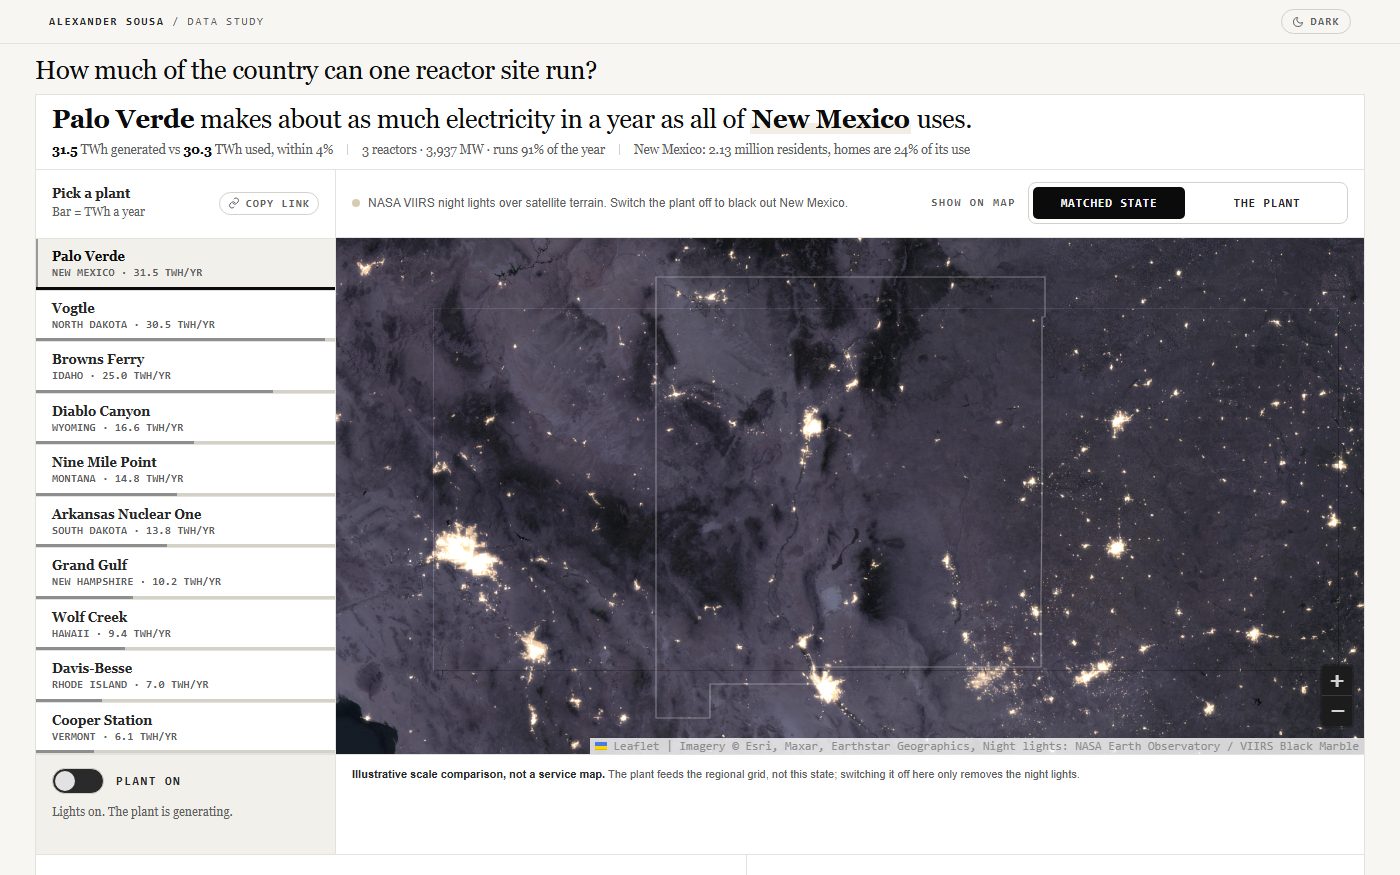
Palo Verde alone generates about as much electricity a year as the entire state of New Mexico uses.
Question
Nuclear output is quoted in megawatts and terawatt-hours, numbers that don’t mean much on their own. I wanted to know, plainly, how much of the country one reactor site actually runs.
Function
Matches each of ten operating U.S. nuclear plants to the single state whose total yearly electricity use, homes, businesses and industry together, comes closest, then opens on that state in real NASA night-lights imagery and lets the plant be switched off to watch its grid go dark, chunk by chunk. Below the map, the same yearly output is restated as the capacity it would take to build instead from gas, wind or solar, and the land an equivalent solar or wind field would actually cover, drawn to scale next to the reactor site.
Limitation
The darkened state is a size comparison only, not the plant’s real service territory; no nuclear plant sells its power to a single state, and the grid it feeds crosses state and utility lines. Capacity factors and land-use figures are representative industry averages (EIA, NREL), not site-specific engineering estimates.