Priced In
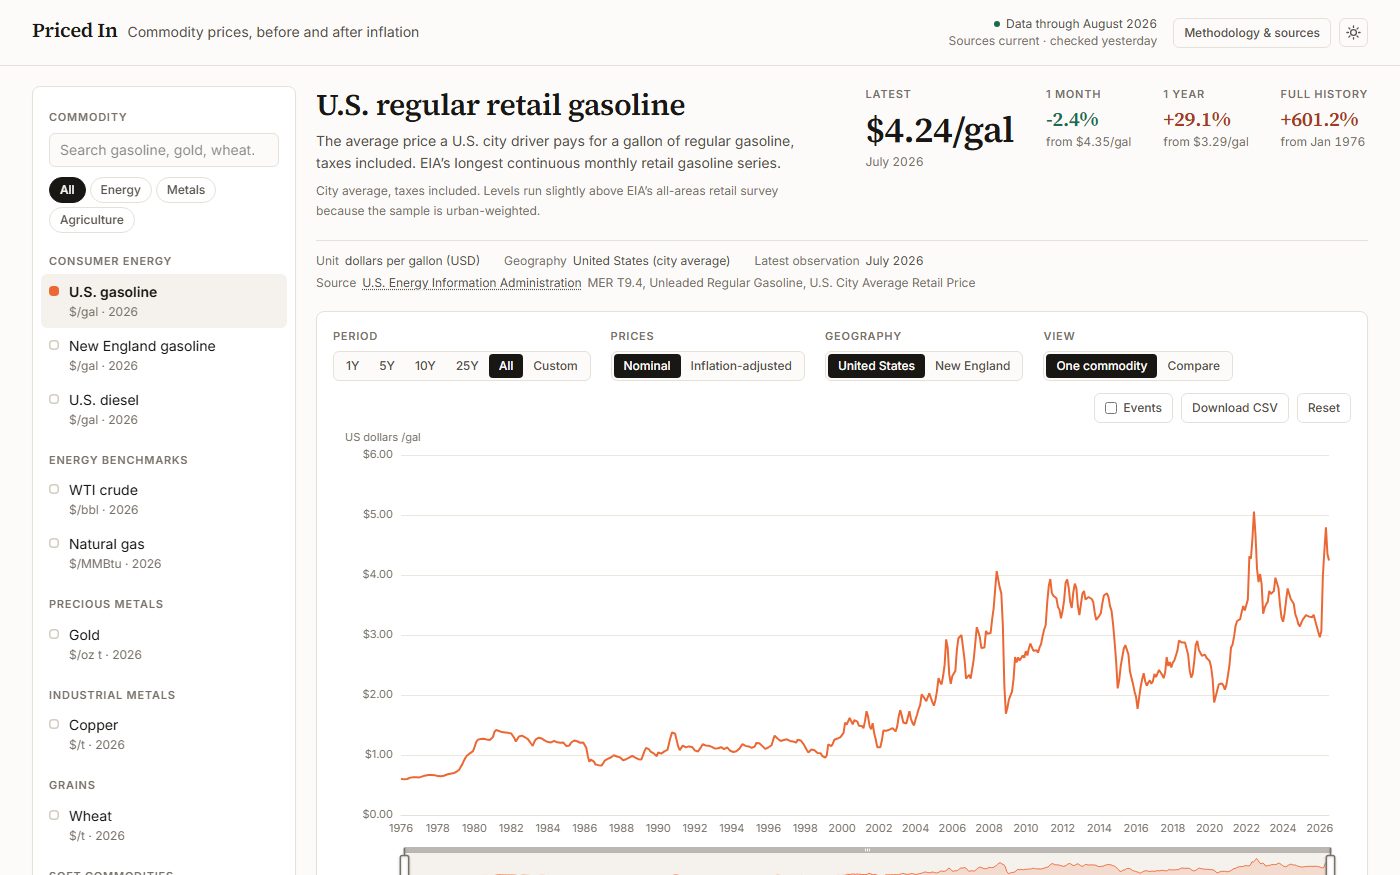
U.S. gasoline is up 601% since 1976 in nominal dollars, and 17% once inflation is stripped out.
Question
Gas prices get called record highs constantly, and the claim rarely says record compared to what. I wanted the actual comparison: what a gallon costs today against every past month, in dollars that mean the same thing.
Function
Nine commodities, gasoline, crude oil, natural gas, metals and grains, charted in both nominal and inflation-adjusted dollars, with every price traceable to its official government or World Bank source. A base year restates the whole series in that year's dollars, and a shared-baseline indexed view lets series with completely different units, dollars per gallon against dollars per ounce, sit on one comparable axis. Where BLS never published a CPI figure for a month, the gap is interpolated and labeled everywhere it appears rather than smoothed over silently.
Limitation
The site restates published prices; it does not forecast them or recommend buying or selling anything. Gasoline draws on EIA's Monthly Energy Review rather than its retail survey specifically to reach back to 1976, which leaves it running about a month behind the other series. CPI interpolation only fills interior gaps between two published months; nothing is ever extrapolated past the newest available figure.